Mobility & Sustainability / 2025
SUV & Car Battery Cooling System Design
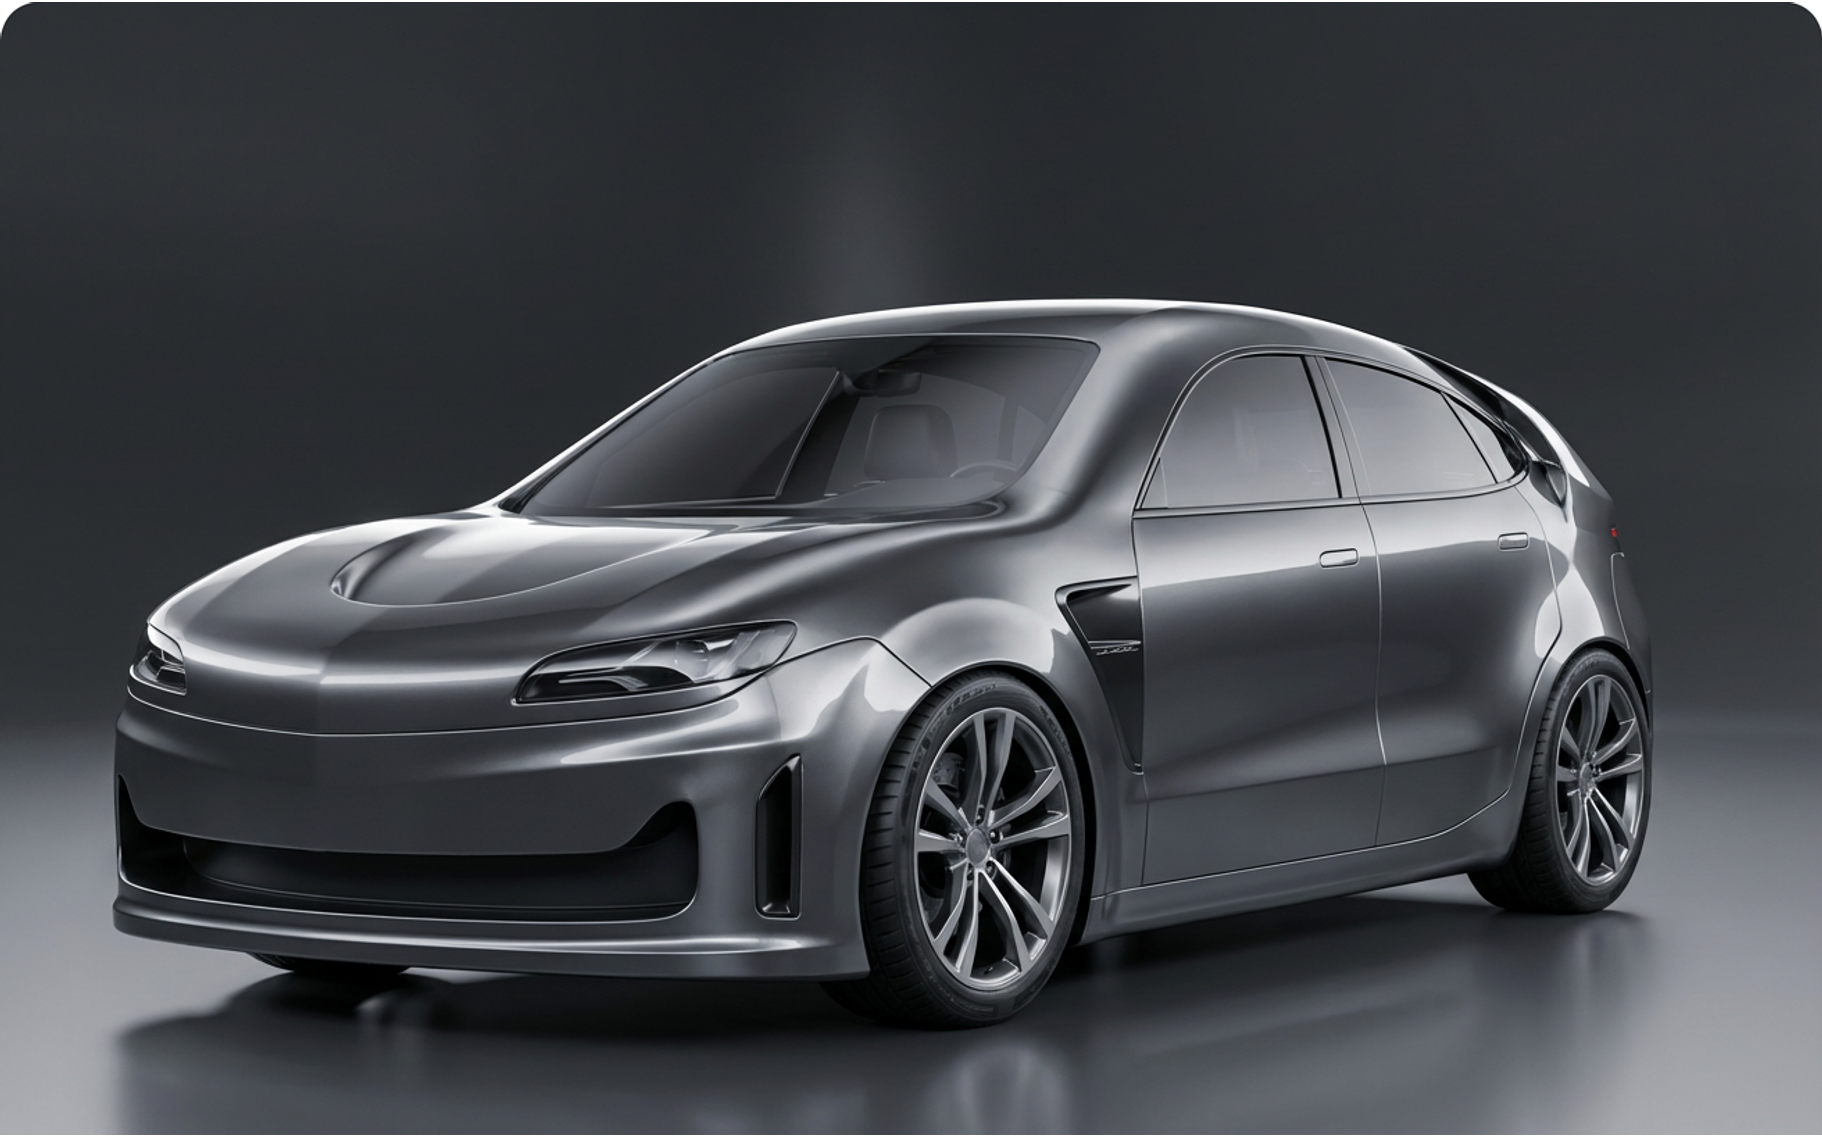
A vehicle concept and EV battery cooling system developed through aerodynamic and thermal-fluid analysis.
Skip to the design & results ↘The vehicle geometry
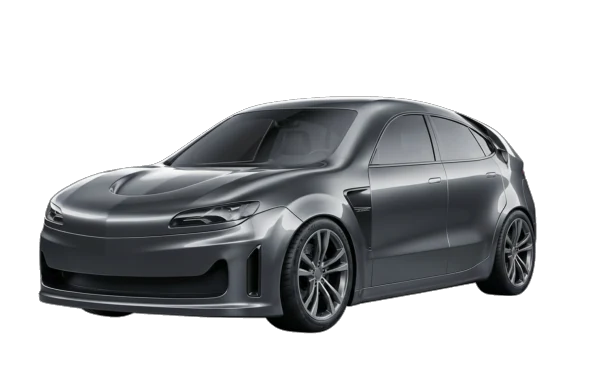
Explore the exterior concept, from its front channel and wheel region to the rear flow-control surfaces.
SUV & BATTERY COOLING
Two flows.
One vehicle.
Shape the air around the vehicle. Distribute coolant through the battery plate. Two investigations connect geometry with measurable behaviour.
Numerical prediction
Measured at 30 m/s
Maximum battery temperature
Total heat removed
01 / EXTERIOR STRATEGY
Shape the flow.
Then test the shape.
The design uses local flow-control features within a smooth SUV body. Each feature is a design intention; the flow study reveals what still needs work.
Guide the incoming air.
An SF90-inspired front passage organises flow over the hood. Smooth upper surfaces aim to maintain attachment towards the roof.
Manage the wheel region.
The air-curtain inlet directs air around the front wheel. The wheelhouse remains a source of disturbance to refine.
Control where flow leaves.
An i8-inspired C-pillar split and rear shaping aim to organise separation. Testing identifies the tail as the next design priority.
02 / PHYSICAL VALIDATION
Out of the screen.
Into the tunnel.
A printed PLA model brings the surface geometry into a physical flow test. Tufts reveal local motion while force readings support coefficient comparisons.
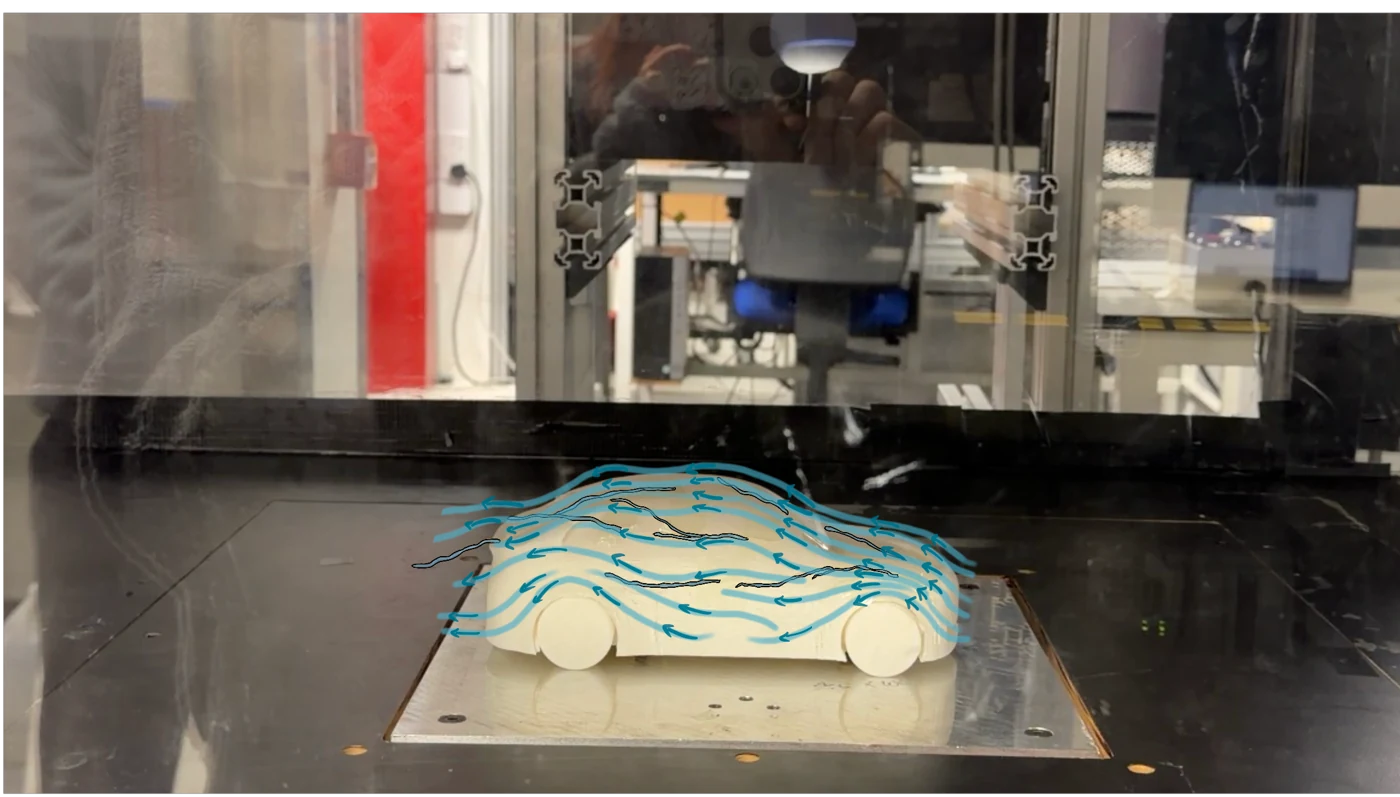
Surface tufts and the report’s flow annotations show the direction of near-surface flow.
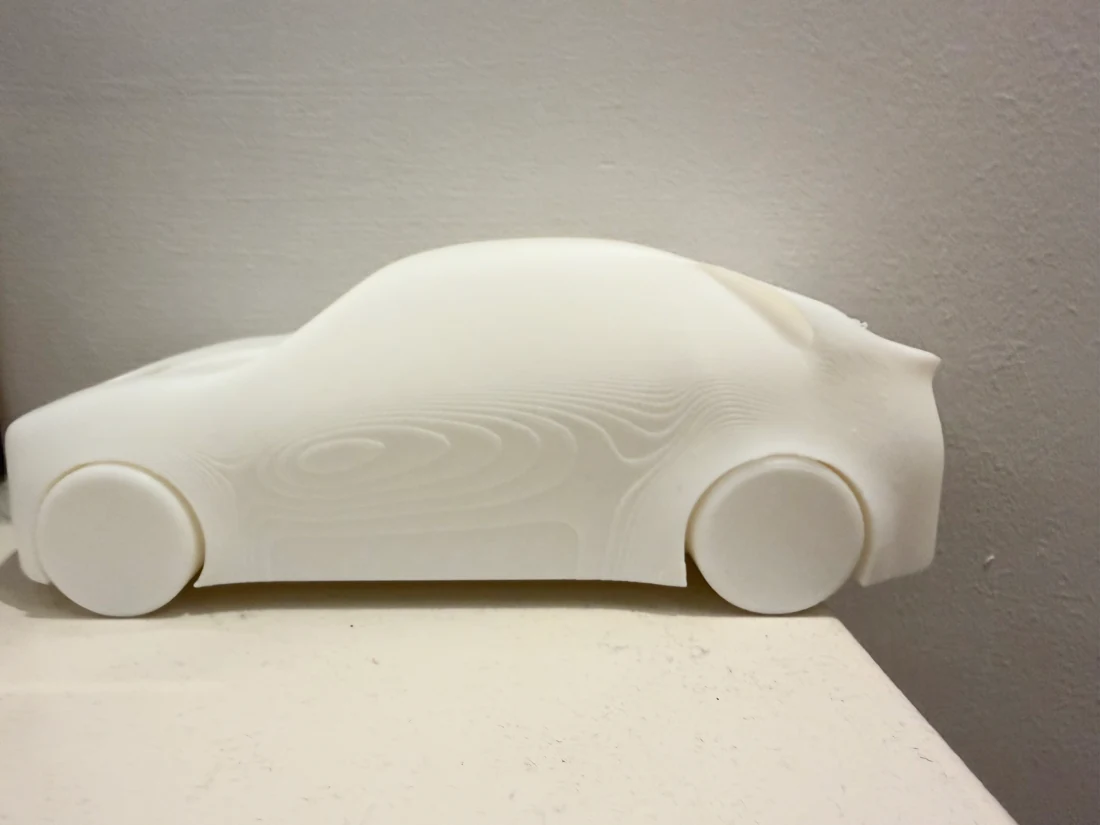
- Prototype envelope
- 233 × 107 × 86.78 mm
- Printer
- Bambu X1 Carbon
- Print time
- 7 h 25 min
- Mounting
- Four M8 fixings
The rear is the weak point.
At 10, 20 and 30 m/s, the front and roof tufts stayed largely aligned. Persistent movement at the rear identified the dominant separation region; the oscillation became stronger as tunnel speed increased.
03 / AERODYNAMIC EVIDENCE
A prediction.
A physical check.
The reported wind-tunnel drag coefficient falls as test speed rises. At 30 m/s, the measured value remains above the CFD prediction.
Report summary value
Tunnel reference area: 0.00833 m². Each bar is a reported test point; the CFD reference is shown separately.
Cd gap between tunnel and CFD
The two methods identify the same rear separation problem. Printed surface roughness, numerical resolution, turbulence modelling and experimental uncertainty can explain part of the difference.
- CFD lift coefficient
- 0.240
- Tunnel lift coefficient
- 0.206
Both lift coefficients are positive. Vehicle stability was not established by this comparison alone.
Test readings & interpretation
| Speed | Drag force | Cd |
|---|---|---|
| 10 m/s | 0.19–0.20 N | 0.37 |
| 20 m/s | 0.68–0.70 N | 0.32 |
| 30 m/s | 1.53–1.54 N | 0.31 |
The speed dependence is consistent with a Reynolds-number effect in the small model. Repeated runs and a consistent area/scale record would strengthen the comparison. The report uses slightly different area figures in its setup text; this page uses the 0.00833 m² value associated with the reported drag coefficients.
04 / BATTERY COOLING
Share the flow.
Spread the cooling.
The selected cold plate uses parallel branches, distributing manifolds and two inlets. The design balances heat-transfer area against hydraulic resistance.
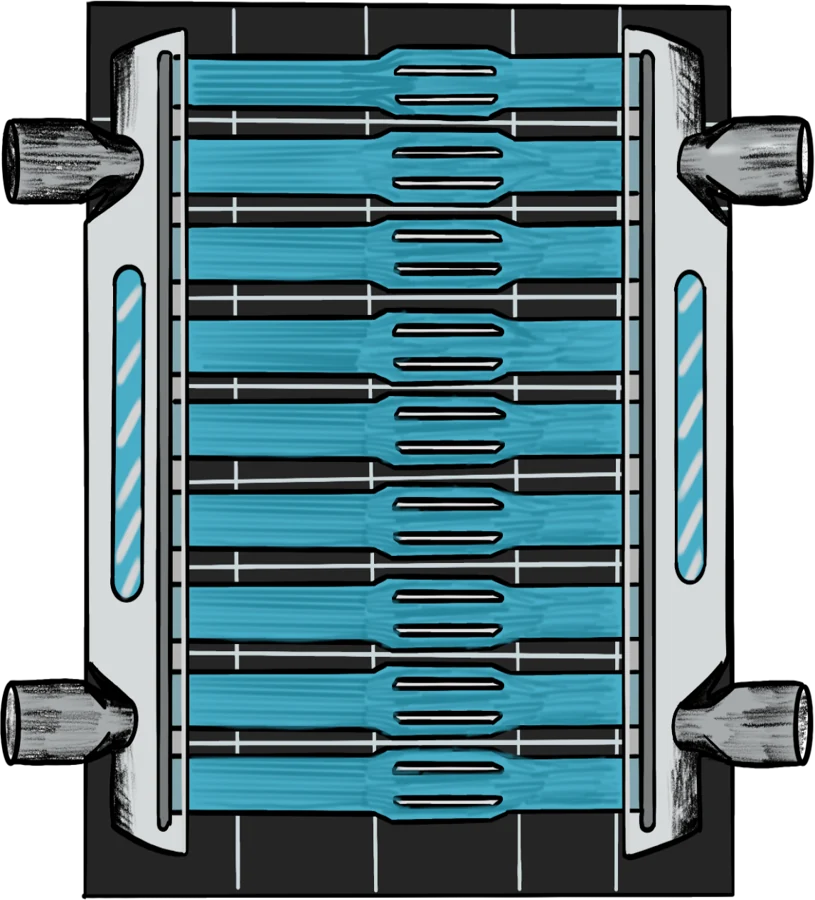
A network, not
a single long passage.
Parallel flow paths offer broad coverage. Manifolds distribute and collect the coolant; tapered transitions moderate abrupt changes in flow area.
- Parallel branches
- Increase wetted area and spread cooling across the plate.
- Dual inlet / outlet
- Shorten the distribution path and improve symmetry.
- Tapered transitions
- Reduce sudden area changes at branch connections.
Entrance restrictors were considered during concept development but omitted from the simulated CAD model.
WHY THIS ARCHITECTURE?
Parallel
Shorter flow paths and lower restriction, with distribution imbalance to manage.
Serpentine
Broad coverage through a longer route, with more turns and pressure loss.
The selected refinement
Keep the parallel layout; improve headers and local heat-transfer regions.
05 / THERMAL-FLUID RESULTS
Look beyond
the average.
The refined CFD solution reports an average battery temperature of 42.5°C and a maximum of 46.6°C. The spatial field shows why both values matter.
Simulation setup & limits
- Software
- Ansys Discovery 2025 R2 / Refine
- Mass-flow inlets
- 2 × 0.005 kg/s at 20°C
- Pressure outlets
- 2 × 0 Pa static pressure
- Initial / ambient temperature
- 25°C
- Volumetric heat source
- 1.03 × 10⁵ W/m³
- External convection
- 10 W/m²·K at 25°C
- Cold plate / coolant
- Aluminium 6061-T4 / water
- Refined mesh
- 630,636 elements / 170,989 nodes
No formal mesh-independence study was completed. The thermal results support this concept evaluation; they are not physical battery-test measurements. Values here follow the detailed setup and CFD output in the report, which resolve the summary’s inconsistent maximum-temperature label.
06 / THE NEXT ITERATION
Better cooling.
At what resistance?
Lower temperature and lower pressure drop are competing objectives. The next iteration should vary the flow geometry while checking both outcomes under the same conditions.
Widen the manifold
Lower local velocity and header losses
Whether branch flow stays balanced
Smooth the transitions
Reduce contraction and turning losses
Pressure drop at matched inlet flow
Widen the channels
Reduce hydraulic resistance
Any increase in peak battery temperature
Lengthen local cooling paths
Increase coolant contact and heat transfer
The added frictional pressure loss
How the hand calculations inform the next test
The one-dimensional thermal estimate reports 91.19°C, while the spatial CFD model reports 46.6°C. These should not be treated as a controlled improvement percentage: their inlet conditions, heat input and heat-loss assumptions differ.
The analytical pressure-loss section gives 1.399 Pa, while the later comparison table gives 9.8 Pa. Until that discrepancy is reconciled, the page uses the consistently reported CFD pressure drop of 15.1 Pa and keeps the analytical values out of the headline comparison.